1. Sprint Burndown
The sprint burndown chart visualizes how many story points have been completed during the sprint and how many remain, and helps forecast if the sprint scope will be completed on time.
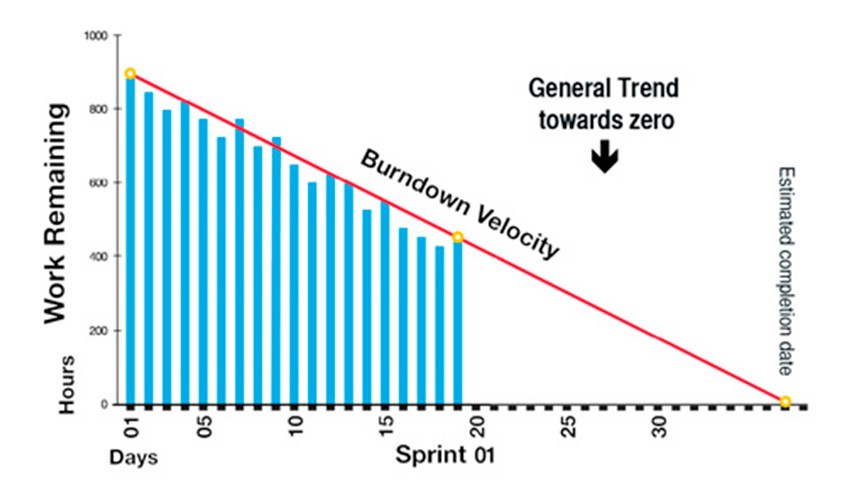
Why it is powerful: Makes it instantly clear how much value a sprint has already delivered and how close we are to completing our commitment to customers.
2. Agile Velocity
Velocity measures how many story points were completed by a team, on average, over the past few sprints. It can be used to predict the team’s output in the upcoming sprints.
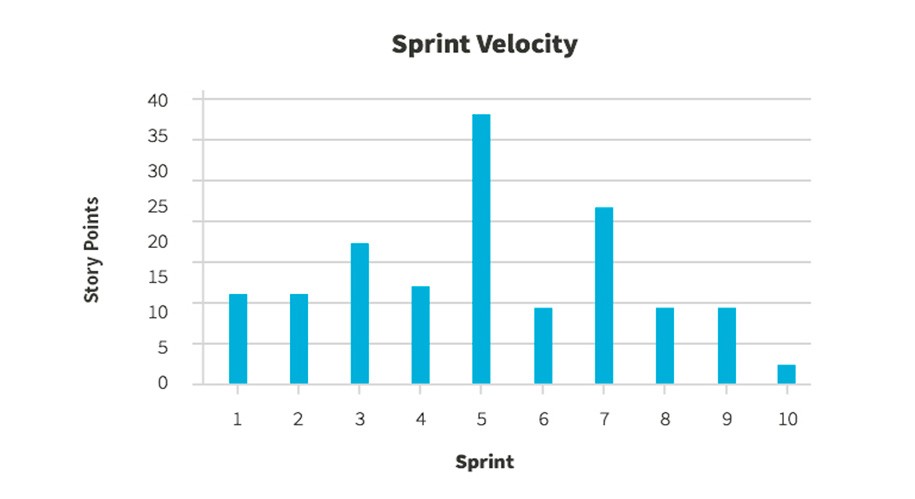
Why it is powerful: Velocity is powerful because it’s a result metric – how much value was actually delivered to customers in a series of sprints. Be careful not to compare velocity across teams because story points and definition of done can vary between teams.
3. Lead Time
Lead time measures the total time from the moment a story enters the system (in the backlog), until it is completed as part of a sprint, or released to customers. It measures the total time for a requirement to be realized and start earning value – the speed of your value chain.
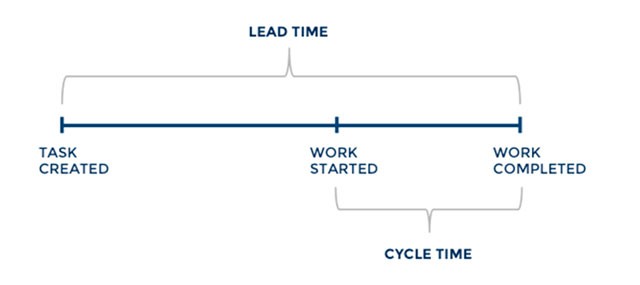
Image Source: Screenful
Why it is powerful: In a sense, lead time is more important than velocity because it measures the entire agile system from end to end. Reducing lead time means the entire development pipeline is becoming more efficient.
4. Cycle Time
As illustrated above, the cycle time is a subset of lead time – it measures the time for a task to go from “started” or “in progress” to “done”. Normally, cycle times should be around half the sprint length. If cycle times are longer than a sprint, teams are not completing work they committed to.
Why it is powerful: A very simple metric that can raise a red flag when items within sprints across your entire system are not moving forward.
5. Code Coverage
Code coverage measures the percentage of your code which is covered by unit tests. It can be measured by the number of methods, statements, branches or conditions which are executed as part of a unit test suite.
Why it is powerful: Code coverage can be run automatically as part of every build and gives a crude picture showing how much of the codebase has been tested. A low code coverage almost always indicates low code quality. However, a high coverage may not equal high quality, because there are other types of tests – such as UI or integration tests – which are not counted.
6. Static Code Analysis
While not exactly a metric, this is an automated process that can provide insights into code quality and clean code from simple errors redundancies. Code quality, while difficult to define and measure, is known to be a key contributor to software quality in general, and in particular, software maintainability.
Why is it powerful: Static code analysis provides a safe baseline for code quality. However, it is no substitute for human input into code quality, via manual code reviews, pair programming or other methods.
7. Release Net Promoter Score
Net Promoter Score (NPS), calculated for a software release, measures whether users would recommend the software to others, do nothing, or recommend against using it. It is an important gauge of customer satisfaction.
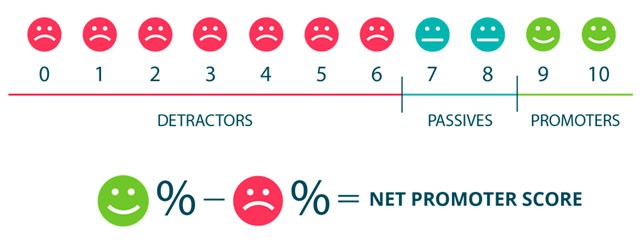
Image Source: Wootrick
Why it is powerful: The ultimate test of agile development is providing value to a customer. If customers are recommending this new release to others, that is a clear indication of success. If not, you can use this as a warning metric and use other data to understand what’s wrong.
8. Cumulative Flow
This is a kanban metric which shows the status of tasks – in a sprint, a release or across software teams. It can visualize bottlenecks in the process – a disproportionately large number of tasks in any of the workflow stages indicates a problem. For example, a big “bubble” in the chart in a verification or testing stage indicates this stage has insufficient resources.
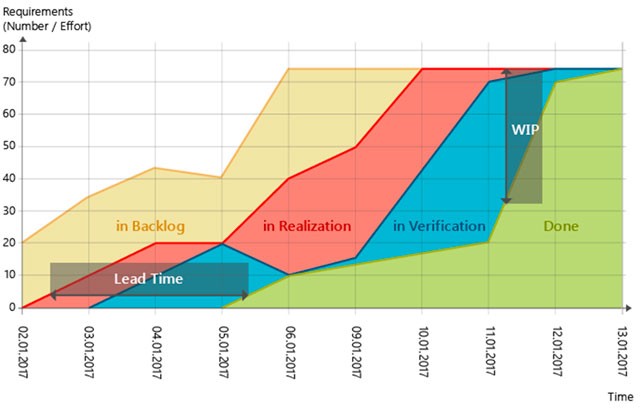
Image Source: MicroTool
Why it is powerful: As with the burndown chart, the power of this metric is in its visual simplicity – you can grasp a process in one glance and immediately identify issues. Cumulative flow lets you catch problems in mid-process before they result in delayed delivery.
9. Failed Deployments
Measures the number of deployments (either to test, production environments, or both). Can help understand how solid environments are and whether teams are really building potentially shippable software.
Why it is powerful: Especially when applied to production environments, this metric can provide a clear indication that sprints or releases are production ready, or not.
10. Escaped Defects
The number of bugs discovered only after a build or release enters production. Escaped defects should ideally be zero. Measuring them across releases or teams provides a crude, but still highly relevant, a measure of deployed software quality.
Why it is powerful: Production bugs, especially if frequent, are a problem in the agile process. Just like in lean manufacturing, we should “stop the production line” and discover what’s wrong.
The Missing Metric: Quality Intelligence
We presented several powerful metrics that provide important insights into the agile process. However, there is no single metric as clear or powerful as the burndown chart or cycle time, which can tell us the most important thing: “how good” is the software being built by our developers.
A new category of tools called Software Quality Intelligence can provide this missing metric: a clear view of software quality. SeaLights is a platform which combines data about code changes, production uses and test execution, to provide the following quality metrics:
- Test gap analytics—Identifying areas where the code was recently changed or executed in production but is untested. Test gaps are the best place to invest resources to improve quality.
- Quality trend intelligence—Showing which parts of a system are improving in quality coverage, and which are getting worse—meaning more testing time should be invested.
- Release quality analytics—SeaLights performs real-time analytics on hundreds of thousands of test executions, code changes, builds and production events to assess the readiness of a release. Which build is best and provides the highest quality for users?
Comments
Post a Comment